

Abstract
Objective: To determine the association of structural and vascular parameters using optical coherence tomography (OCT) angiography (-A), in patients diagnosed with primary congenital glaucoma (PCG).
Material and methods: 40 patients diagnosed with PCG were recruited (only one eye per patient was included). All study participants underwent a comprehensive ophthalmologic examination. Peripapillary and macular vascular measurements were obtained using AngioplexTM OCTA with a 4.5×4.5mm optic nerve head scan and 6x6mm macular scan. Structural parameters were collected: circumpapillary Retinal nerve fiber layer (cpRNFL) thickness (global and quadrants), ganglion cell-inner plexiform layer complex (GCL+IPL) thickness (average, minimum and sectors), rim area, average and vertical cup to disc (C/D) ratio and cup volume.
Results: Global peripapillary values were: Mean flux index (FI) was 0.39 (0.05), mean perfusion density (pPD) was 42.57 (4.56) %, cpRNFL was 78.65 (22.50) microns, average c/p ratio (0.59 (0.18) and global GCL+IPL thickness was 71.71 (14.81) microns and minimum GCL+IPL thickness was 64.18 (18.63) microns. Statistical correlation was found between peripapillary structural, vascular and morphologic parameters (all p<0.023).
Conclusion: OCTA measurements could offer useful and objective measurement of damage in early and severe congenital glaucoma, complementary to that offered by OCT.Resumen
Objetivo: Determinar la asociación entre los parámetros estructruales y vasculares usando la angiografia (angio-) con tomografía de coherencia óptica (OCT), en pacientes diagnosticados de glaucoma congénito primario (GCP).
Material y métodos: se incluyeron un total de 40 pacientes diagnosticados de GCP (un ojo por paciente). Se realizó una exploración oftalmológica completa. Se recogieron todas las mediciones obtenidas mediante la Angio-OCT AngioplexTM, a nivel peripapilar con un scan de 4,5×4,5mm y a nivel macular de 6x6mm. Y se recogieron los siguientes parámetros estructurales: grosor global y por cuadrantes de la capa de fibras nerviosas peripapilar (cpRNFL), grosor promedio y mínimo del complejo de células ganglionares+plexiforme interna (GCL+IPL), área del anillo, relación copa-disco promedio y por sectores y volúmen de la copa.
Resultados: los valores globales peripapilares fueron: el FI medio fue 0,39 (0,05), la densidad de perfusión media (pPD) fue 42,57 (4,56) %, la cpRNFL global promedio fue 78,65 (22,50) microns, el ratio C/D fue 0,59 (0,18) y el grosor global de GCL+IPL fue 71,71 (14,81) miras. Se encontró una correlación estadística entre los parámetros vasculares y estructurales (todos p<0,023).
Conclusion: Angio-OCT ofrece información objetiva del daño secundario al glaucoma, complementaria a la que ofrece OCT.Keywords: OCTA; OCT; Primary congenital glaucoma; Severity of glaucoma.
Palabras clave: Angio-OCT; OCT; Glaucoma congénito primario; Gravedad de glaucoma.
INTRODUCTION
The recent development of Optical Coherence Tomography Angiography (OCTA) offers in vivo information of the retinal and choroidal microvasculature in different regions (1). This non-invasive technique, using contrast imaging, allow us to obtain a quantitative assessment of the optic nerve head (ONH), peripapillary and macular microvascularity (2). It has been reported that glaucoma patients present a decrease of these vascular parameters (3).
Previous studies reported that OCTA optic nerve head (ONH) vessel density measurements are associated with the severity of glaucoma and a strong correlation has been demonstrated between structural and vascular parameters. Indeed, lower ONH perfusion has also been related to a thinner macular ganglion cell complex and lower macular vessel density in adults with glaucoma (4,5).
In normal children (6), OCTA parameters were reported in several articles. However poor information is available about the peripapillary and macular microvasculature in the literature in childhood glaucoma.
Primary Congenital Glaucoma (PCG) is a rare disease but it is an important cause of vision loss in children. The diagnosis of PCG is based on clinical criteria. However, in the last years the introduction of new devices such as optical coherence tomography (OCT), has proved to be useful for the management of paediatric glaucoma (7) as it provides objective retinal nerve fiber layer (RNFL) thickness and ganglion cell complex measurements (1). Recently, reduced peripapillary vascular parameters were reported in juvenile glaucoma using OCTA (8), however no information about changes on retinal micro vascularity were reported in PCG.
This study was designed to determine the association of structural and vascular parameters using Cirrus OCT and OCTA, in patients diagnosed with primary congenital glaucoma.
MATERIAL AND METHODS
Study participant
Observational and cross-sectional study. A total of 40 patients diagnosed with PCG were recruited. This study protocol adhered to the tenets of the Declaration of Helsinki and was approved by the Ethics Committee of the Hospital (a National Reference Centre for infant glaucoma). All participants aged 18 years or older, signed a written informed consent and it was obtained from the parents or legal guardians of participants younger than this age (all children gave their verbal consent to participate in our study).
40 children diagnosed with PCG were recruited. Diagnostic criteria for PCG according to the Childhood Glaucoma Research Network classification are (9): IOP > 22 mmHg, clinical sings of glaucoma such as enlarged corneal diameter, Haab’s striae and glaucomatous appearance of the optic nerve head. Those included eyes had sufficient visual acuity for fixation, BCVA equal or higher than 0.05, good ocular media transparency and no other previous ocular surgery excepting glaucoma surgeries. The presence of nystagmus or leukoma was an exclusion criterion.
All study participants underwent a comprehensive ophthalmologic examination by a single experienced examiner (LMF).The ophthalmic exam included: best-corrected visual acuity (BCVA) using decimal Snellen scale, and refractive state expressed as spherical equivalent (SE; cycloplegic refraction), intraocular pressure using the portable version of the Goldmann tonometer (Perkins,….), dilated fundus examination including cup-to-disc ratio determined by the same examiner (LMF), OCT and OCTA measurements using Cirrus OCT (HD-OCT 5000; Carl Zeiss Meditec, Inc., Dublin, CA, USA).
When both eyes were eligible, only one eye was randomly selected (using a randomization web www.randomization.com).
OCTA measurements
SD-OCT Cirrus ((Cirrus, HD-OCT 5000; Carl Zeiss Meditec, Inc., Dublin, CA, USA) was used to acquire macular and peripapillary scans. (11). The device´s software AngioplexTM (version 10.0, Carl Zeiss Meditec) includes the algorithm “optical microangiography” (OMAG). This software with FDA approval, offers automatic measurements of vascular parameters in the superficial retinal plexus.
All scans were performed using eye- tracking, by the same operator (LMF) with pupil dilation in a dark room on the same day as the other tests. Only good-quality scans with a signal strength index (SSI) >8 were included.
Figure 1 shows the scan areas and the segmentations.
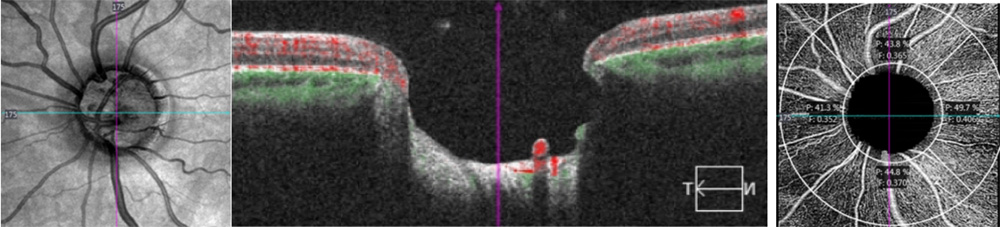
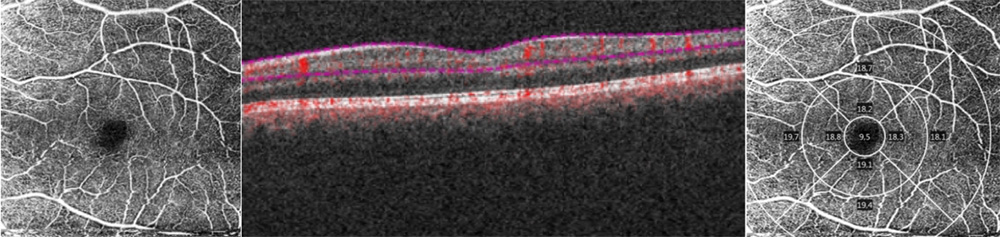
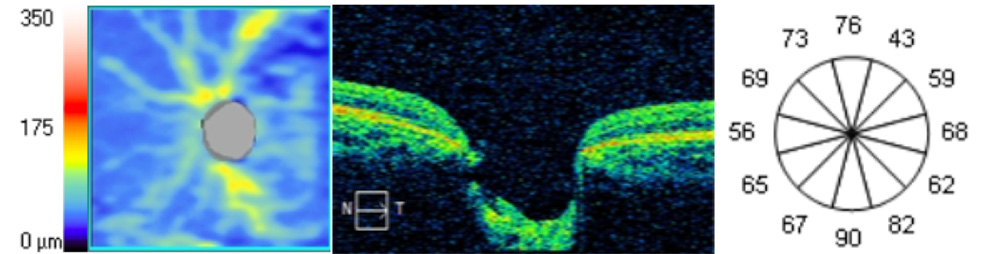
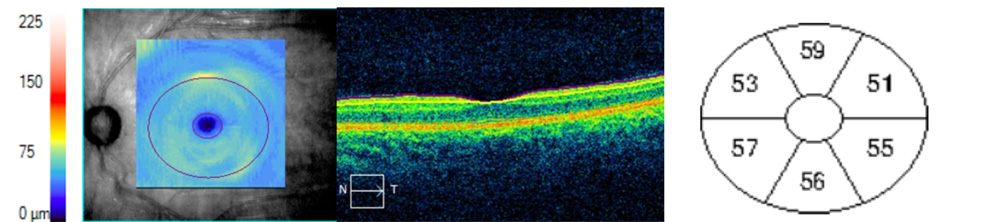
Figure 1. 1 Angiography slabs of the optic nerve head 4.5×4.5mm scan showing the radial peripapillary capillary (1a) and superficial angiography slabs of the 6×6 mm macular scan (1.b) obtained using OCT Cirrus 5000 (1.b) in a PCG eye. Representative OCT scans of cpRNFL thickness (1.c) and macular GCL+IPL analisis (1.d) in a PCG eye.
Peripapillary scans (4.5×4.5mm) were performed for each patient, centred on the optic nerve. Automatically, AngioplexTM analyse the superficial microvasculature located between an inner circle with a radius of 2mm and an outer circle with a 4.50 mm radius both centred on the ONH, divided on four quadrants: superior, inferior, temporal and nasal. Two peripapillary parameters were recorded: peripapillary perfusion density (pPD) and flux index (FI) for the global and quadrants (superior, temporal, inferior and nasal). pPD (the total area of perfused radial peripapillary capillary vasculature per unit area, %); and FI (a parameter between 0 and 1 representing the average decorrelation signal, no units) (figure 1.a.).
Macular scans (6x6mm) centred on the fovea were obtained for each PCG patient. And AngioplexTM automatically calculate 2 macular parameters: macular vascular density (the total length of blood vessel from the skeletonized image to the total area, mVD, mm 1); and macular perfusion density (the total area of perfused vasculature per unit area, mPD, %).
The macular scan is subdivided into the Early Treatment of Diabetic Retinopathy Study (ETDRS) map: central circle (cC) within the 1-mm central circle centred on the fovea, an inner circle (iC) from 1 to 3 mm, an outer circle (oC) from 3 to 6 mm and a whole circle (w) (Figure 1.b). All mPD and macular VD measurements (global and circles) were collected.
And foveal avascular zone (FAZ) was analysed: FAZ area (the macular foveal area without blood flow signal, mm2), the FAZ perimeter (mm), and the acicularity index (the measured perimeter of FAZ-to-the perimeter of projected circle ratio with the same area as the FAZ, AI; from 0 to 1).
OCT measurements
The images of Macular and peripapillary 6×6 mm scans were acquired with the same instrument SD-OCT (Cirrus, HD-OCT 5000; Carl Zeiss Meditec, Inc.) to get optic nerve head measurements: circumpapillary Retinal nerve feber layer (cpRNFL) thickness (average and quadrants superior, nasal, inferior and temporal), disc area (mm2), rim area (mm2), average C/D ratio and vertical C/D ratio (figure 1.c); and macular measurements: average ganglion cell layer and inner plexiform layer (GCL+IPL) thickness, minimum GCL+IPL thickness and superior, superior nasal, superior temporal, inferior, inferior nasal and inferior temporal GCL+IPL thickness (figure 1.d).
Statistical analysis
Statistical analyses were performed using SPSS software (version 20.0; SPSS, Inc., Chicago, IL, USA). Descriptive statistics were used to calculate mean and median of the different demographic and clinical parameters. Pearson correlation test was performed to determine the correlation between structural and functional parameters and significance was taken as p<0.05.
RESULTS
The study population consisted of 40 PCG patients (median age 11 (9-14.75) years). A total of 51 children with PCG were examined however only 40 were finally included in the study group due to poor quality of exams or impossibility to complete OCTA and/or OCT scans.
Demographic and clinical characteristics of the study population are described in table 1. The clinical characteristics of the PCG group were: mean IOP 16.56 (3.87) mmHg (range 7-26 mmHg) and mean number of hypotensive ocular medications used 0.78 (0.67). All eyes required glaucoma surgeries and mean glaucoma surgeries per eye were 1.53 (1.21): in 17 eyes, at least one goniotomy was performed (median number of goniotomies per eye was 1.8 (P25-P75= 1.3-2.6). 12 eyes required at least one trabeculectomy (median number of trabeculectomies per eye was 1.2 (P25- P75=1-2) and 3 eyes required the implantation of an Ahmed valve.
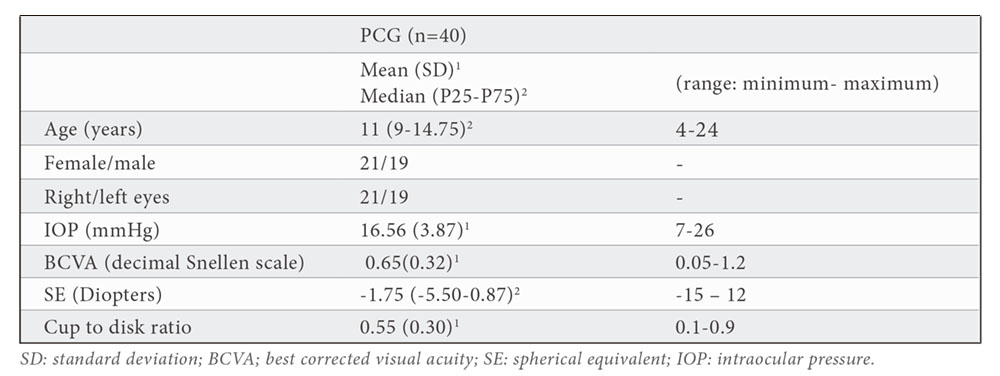
Table 2 shows all peripapillary OCT and OCT-A measurements. Mean pPD was 42.57 (4.56) % and flux index was 0.39 (0.05). pPD and FI measurements were lower in vertical quadrants than horizontal quadrants (superior pPD=39.06(8.98) % ,inferior pPD=40.39 (5.66)%, superior FI=0.38 (0.05) and inferior FI=0.38 (0.06). the highest pPD and FI values were obtained in the temporal quadrant (pPD=46.48 (3.92) % and FI=0.40(0.06).
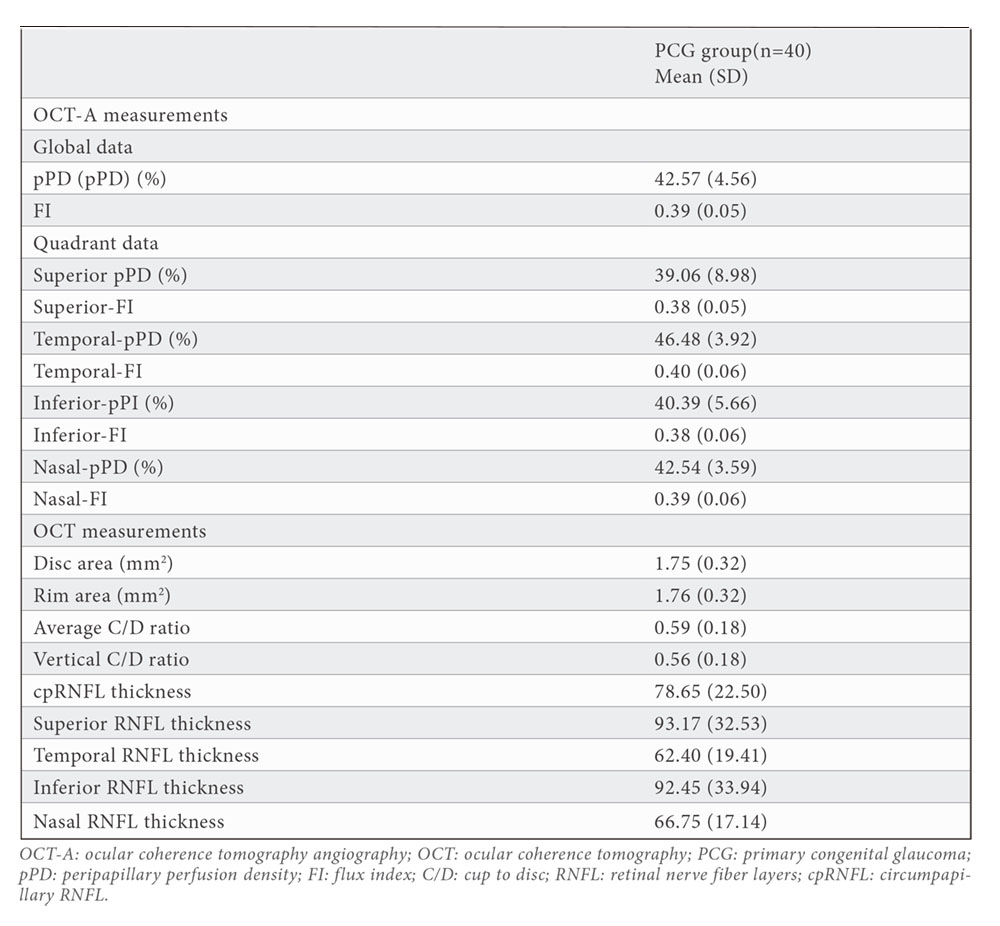
Average cpRNFL thickness was 78.65 (22.50) microns. cpRNFL thickness in inferior quadrant was lower (92.45 (33.94) microns) than cpRNFL thickness in superior quadrant (93.17 (32.53) microns).
All macular OCT and OCT-A measurements are shown in table 3. W-VD was 16.85 (1.92) mm-1 and w- mPD was 41.43 (4.91) %. As expected, lower values for both parameters were found in the central-circle due to FAZ area is included in this measurement (FAZ area= 0.21 (0.09) mm2). Higher values were found for outer circle for both parameters (oC-mPD=42.42 (5.43) % and oC-VD=17.08 (2.10) mm-1). Average GCL+IPL thickness was (71.71 (14.81) microns and minimum GCL+IPL thickness was 64.18 (18.63) microns.
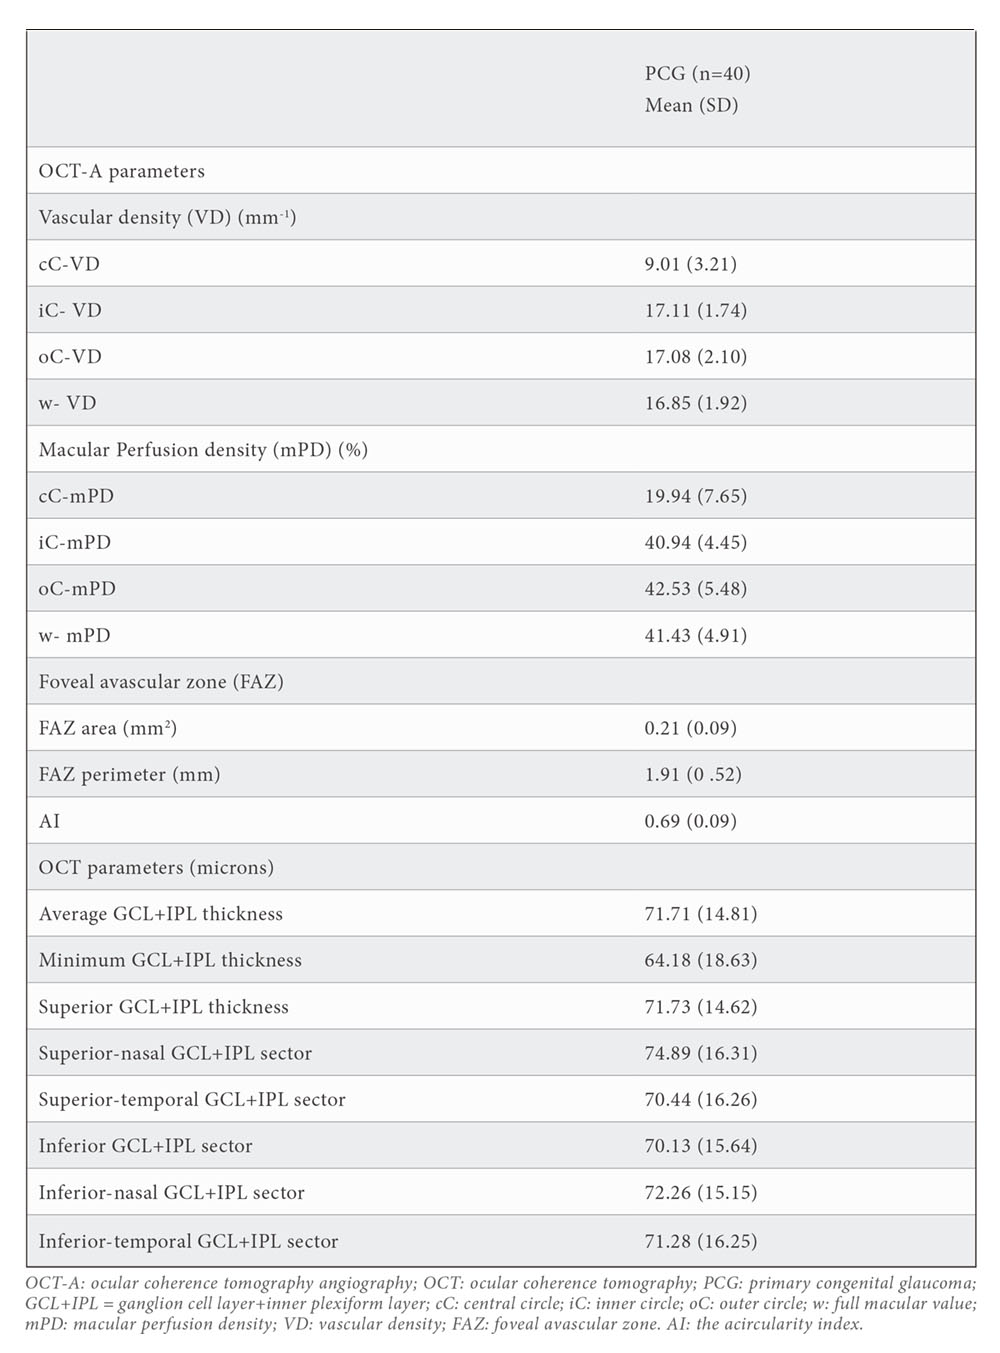
Table 4 represents the correlation between OCT and OCT-A measurements. FI showed a correlation with structural measurements: average cpRNFL thickness (r=0.707;p<0.001), average GCL+IPL thickness (r=0.568;p<0.001) and minimum GCL+IPL thickness (r=0.521;p=0.001); and with morphologic measurements: rim area (r=0.704;p<0.001), average C/D ratio (r=-0.645;p<0.001), vertical C/D ratio (-0.703;p<0.001), cup volume (r=-0.455;p=0.004). pPD showed a correlation with structural measurements: average cpRNFL thickness (r=0.722;p<0.001), average GCL+IPL thickness (r=0.510;p=0.001) and minimum GCL+IPL thickness (r=0.417;p=0.001); and with morphologic measurements: rim area (r=0.652;p<0.001), average C/D ratio (r=-0.554;p<0.001), vertical C/D ratio (-0.632;p<0.001), cup volume (r=-0.368;p=0.023).
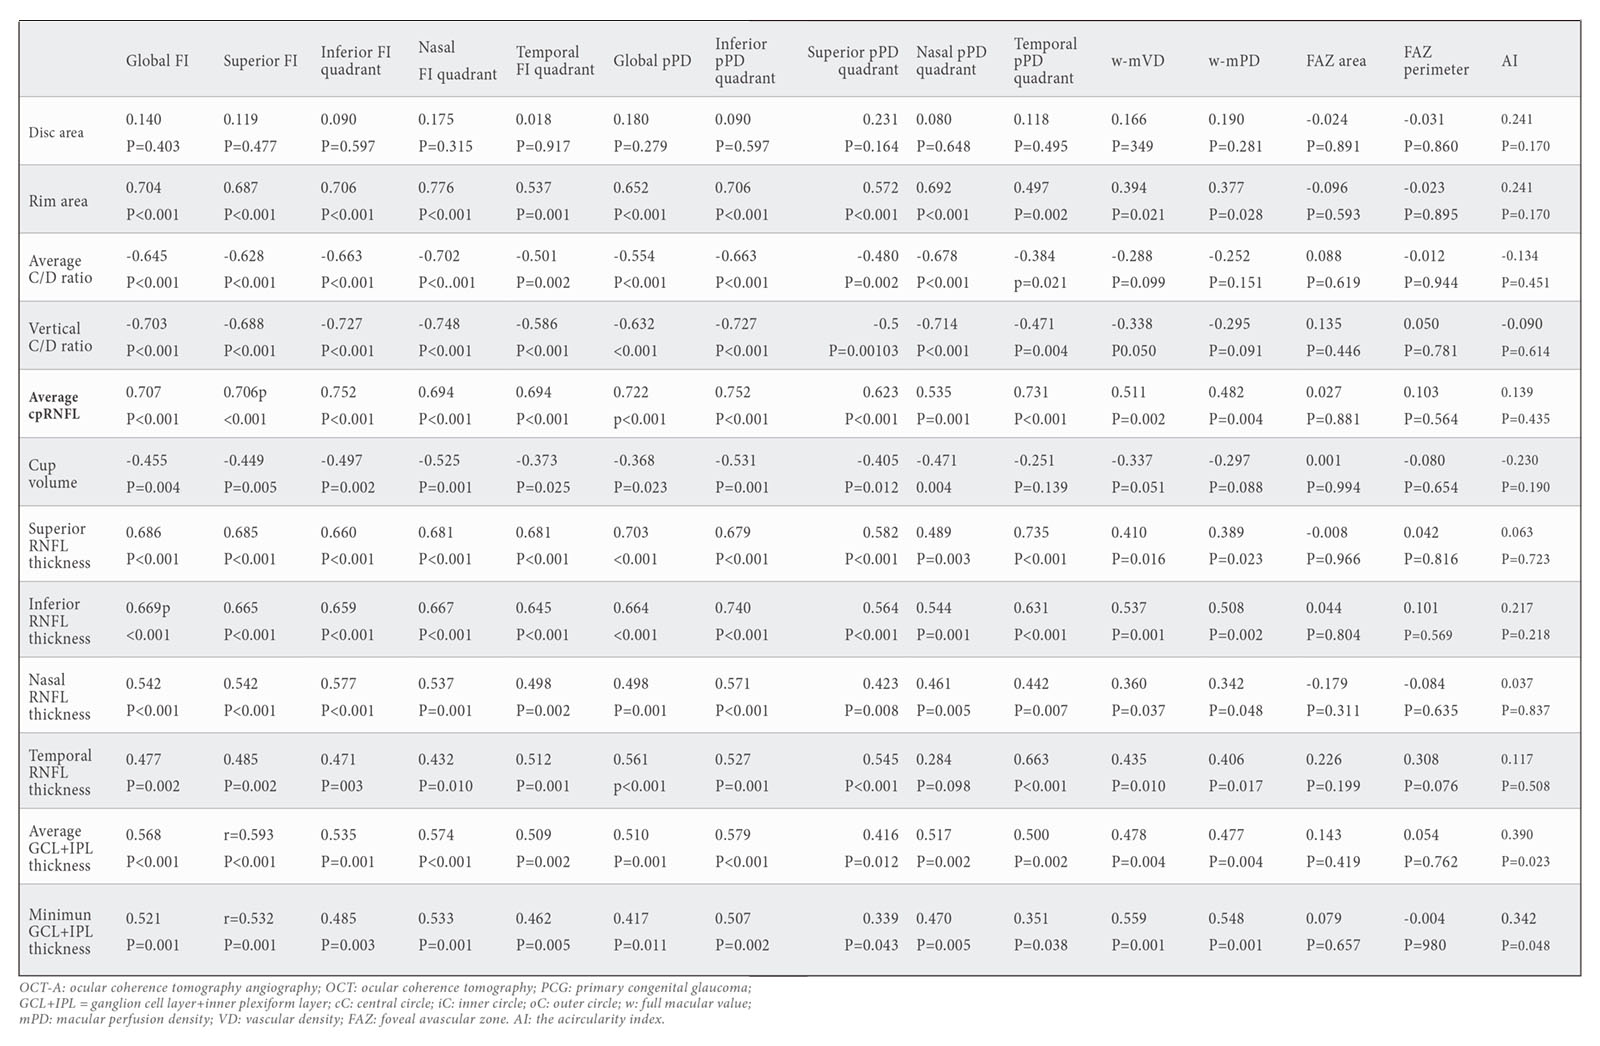
Statistically significant correlation was found between peripapillary structural and vascular parameters in quadrants: Superior RNFL thickness showed a positive correl tion with superior FI (r=0.685;p<0.001) and superior pPD (r=0.582;p<0.001); Inferior RNFL thickness showed a positive correlation with inferior FI (r=0.659;p<0.001) and inferior pPD (r=0.740;p<0.001); temporal RNFL thickness showed a positive correlation with temporal FI (r=0.512;p=0.010) and temporal pPD (r=0.663;p<0.001); And nasal RNFL thickness showed a positive correlation with nasal FI (r=0.537;p=0.001) and nasal pPD (r=0.461;p=0.005).
Indeed, vascular macular measurements showed a strong correlation with macular structural parameters: GCL+IPL thickness with mVD (r=0.478; p=0.004) and mPD (r=0.477; p=0.004). No correlation was detected between FAZ area and structural macular measurements.
DISCUSION
Multiple studies have confirmed the reductions in microvasculature in peripapillary, macular and whole image scans using OCTA in adult glaucoma and the association between severity of glaucoma and vascular damage has been reported (10,11). Changes in peripapillary and macular vascular parameters were reported to have a strongly positive correlation with structural parameters (GCC thickness and RNFL thickness) and a negative correlation with the severity of glaucoma, which mean the more severe the glaucoma was, the lower vascular parameters were (12).
In this study, all peripapillary and macular vascular parameters in the superficial plexus were measured in patients with PCG using AngioplexTM . Recently, Garcia-Perez et al (6) described normal values for all vascular parameters using AngioplexTM, and in comparison, our results show a reduction of all vascular parameters (peripapillary and macular measurements) affecting to all quadrants, in PCG patients. And remarkably, a higher reduction of peripapillary vascular measurements (FI and pPD) was observed in vertical quadrants. These results support the idea of previous studies in children with PCG, suggesting that glaucoma damage in PCG children could differ from that produced in adults, typically with a global loss of ganglion cell complex thickness and circumpapillary RNFL thickness that was particularly marked in the superior and inferior quadrants (7,13).
As in POAG, our results showed a strongly positive correlation between structural and vascular parameters, FI and pPD with cpRNFL thickness in PCG. Indeed, stronger correlation between peripapillary vascular measurements (FI and pPD) and cpRNFL thicknesses was found in superior and inferior quadrants. This finding is consistent with previous studies, showing that these sectors are the most vulnerable sectors to glaucomatous damage (14). And in concordance, also other criteria of severity of PCG such as average C/D ratio, vertical C/D ratio or cup volume, showed negative correlation with vascular measurements (15).
The relationship between vascular and structural parameters has been reported in other studies in adult glaucoma patients. Yarmohamadi et al. (16) reported that the quadratic model provides a better fit for the relationship between vessel density, RNFL thickness and MD than the linear model. And a different behaviour was described in the relationship between structure and vascularization through the stages of severity of glaucoma. Song et al. (17) showed that the relationship is more linear in the early stage of glaucoma. Indeed, in advanced glaucoma (>20db) the decrease in pfVD is almost linear (18).
This suggest that OCTA measurements may offer some advantages for detecting damage of glaucoma, first, in early glaucoma. OCTA measurements may have a potential role in monitoring visual function in eyes with onset glaucoma especially for those who cannot perform a good quality visual field. Supporting this conclusion, Akil et al. (19) reported that the pVD could differentiate early glaucoma from pre-perimetric glaucoma and normal eyes. And, peripapillary VD showed higher diagnostic capacity for detecting functional damage in early glaucoma, even more than cpRNFL thickness (20,21). cpRNFL thickness reaches its baseline level or floor effect before peripapillary vascular parameters (5,21). So, in advanced glaucoma vascularization function allow a better monitoring of the visual function than cpRNFL or GCC thickness (21).
Despite this, the relationship between functional and vascular parameters remain unclear in PCG. In adults, Holló G et al. (11) found that pVD significantly correlated with the corresponding Visual field in glaucomatous eyes, and Kwon JM et al. (20) (reported a significantly correlation between pVD and visual field loss in central field, suggesting that glaucomatous eyes with central field affectation tended to have vulnerable vasculature. New lines of investigation are needed to determine the association between visual field loss and vascular changes in PCG.
The main limitation of our study was, first, the number of cases. PCG is a rare disease and in several cases, it is associated with an opacity of the ocular media, poor fixation or poor vision so those cases are excluded. Indeed, those young patients presents lack of cooperation so very early paediatric ages cannot be considered to be included. As a consequence, a selection bias towards eyes with less severe glaucoma exists. Second, due to the cross-sectional design of the study, to evaluate the impact of other interfering factors such as ocular hypotensive eye drops on vascular measurements is not possible. In this line, longitudinal studies investigating the temporal sequence of OCTA changes would be interesting to address whether those changes are cause or consequence of ONH damage in glaucoma. Third, the possible effect of AL on OCTA measurements was not considered. AL could artefact our results because the magnification effect has been demonstrated for OCT thickness measurements, however some authors reported no correlation between vascular parameters and AL (22).
To conclude, these results highlight the association between the severity of glaucoma and vascular damage in congenital glaucoma. In the clinical practice, OCTA could offer the opportunity to measure vascular parameters and could be a useful tool to determine quantifiable changes on vascular loss specially in early and severe cases of glaucoma.
BIBLIOGRAPHY
- J Jia Y, Morrison JC, Tokayer J, et al. Quantitative OCT angiography of optic nerve head blood flow. Biomed Opt Express. 2012 3(12):3127–3137.
- Fernández-Vigo JI, Kudsieh B, Shi H, et al. Normative Database of Peripapillary Vessel Density Measured by Optical Coherence Tomography Angiography and Correlation Study. Curr Eye Res. 2020; 45(11):1430-1437.
- Manalastas PI, Zangwill L, Daga F, et al. The Association Between Macula and ONH Optical Coherence Tomography Angiography (OCTA) Vessel Densities in Glaucoma, Glaucoma Suspect and Healthy Eyes. J Glaucoma. 2018; 27(3): 227–232.
- Kwon JM, Park K, Kim S, Shin J. Relationship between peripapillary vessel density and visual function based on Garway-Heath sectorization in open-angle glaucoma. Indian J Ophthalmol. 2021; 69(7):1825-1832.
- Sakaguchi K, Higashide T, Udagawa S, Ohkubo S, Sugiyama K. Comparison of sectoral structure- function relationships in glaucoma: Vessel density versus thickness in the peripapillary retinal nerve fiber layer. Investig Ophthalmol Vis Sci. 2017; 58:5251–62.
- Pérez-García P, Morales-Fernández L, Fernández-Vigo JI, et al. Repeatability of Macular and Optic Nerve Head Measurements by Optical Coherence Tomography Angiography in Healthy Children. Curr Eye Res. 2021; 46(10):1574-1580.
- Morales-Fernandez L, Jimenez-Santos M, Martinez-de-la-casa JM, et al. Diagnostic capacity of SD-OCT segmented ganglion cell complex versus retinal nerve fiber layer analysis for congenital glaucoma. Eye. 2018; 32(8):1338-1344.
- Abdelrahman AM, Eltanamly RM, Elsanabary Z, Hassan LM. Optical coherence tomography angiography in juvenile open angle glaucoma: correlation between structure and perfusion. Int Ophthalmol. 2021; 41(3):883-889.
- Beck A, Chang TC, Freedman S, et al. Section 1: Definition, classification, differential diagnosis. World Glaucoma Association Consensus Series-9: Childhood Glaucoma. Amsterdam, The Netherlands: Kugler Publications; 2013. 3–10.
- Holló G. Progressive Decrease of Peripapillary Angioflow Vessel Density During Structural and Visual Field Progression in Early Primary Open-angle Glaucoma. J Glaucoma. 2017; 26(7):661-664.
- Holló G. Comparison of Peripapillary OCT Angiography Vessel Density and Retinal Nerve Fiber Layer Thickness Measurements for Their Ability to Detect Progression in Glaucoma. J Glaucoma. 2018; 27(3):302-305.
- Mansoori T, Sivaswamy J, Gamalapati JS, Balakrishna N. Radial peripapillary capillary density measurement using optical coherence tomography angiography in early glaucoma. J Glaucoma. 2017; 26:438–443.
- Srinivasan S, Addepali UK, Rao HL, Garudadri CS, Mandal AK. Spectral domain optical coherence tomography in children operated for primary congenital glaucoma. Br J Ophthalmol. 2014; 98:162–5.
- Rao HL, Kadambi SV, Weinreb RN, et al. Diagnostic ability of peripapillary vessel density measurements of optical coherence tomography angiography in primary open-angle and angle-closure glaucoma. Br J Ophthalmol. 2017; 101:1066–1070.
- Holló G. Peripapillary capillary vessel density progression in advanced glaucoma: a case report. BMC Ophthalmol. 2019; 19(1):2.
- Yarmohammadi A, Zangwill LM, Diniz-Filho A, et al. Relationship between optical coherence tomography angiography vessel density and severity of visual field loss in glaucoma. Ophthalmology. 2016;123:2498–508.
- Song MK, Shin JW, Jo Y, Won HJ, Kook MS. Relationship between peripapillary vessel density and visual field in glaucoma: a broken-stick model. Br J Ophthalmol. 2021; 105(7):964-969.
- Khayrallah O, Mahjoub A, Ben Abdesslam N, et al. Optical coherence tomography angiography vessel density parameters in primary open-angle glaucoma. Ann Med Surg (Lond). 2021; 69:102671.
- Akil H, Huang AS, Francis BA, Sadda SR, Chopra V. Retinal vessel density from optical coherence tomography angiography to differentiate early glaucoma, pre-perimetric glaucoma and normal eyes. PLoS One. 2017;12:e0170476.
- Kwon JM, Park K, Kim S, Shin J. Relationship between peripapillary vessel density and visual function based on Garway-Heath sectorization in open-angle glaucoma. Indian J Ophthalmol. 2021; 69(7):1825-1832.
- Rao HL, Pradhan ZS, Weinreb RN, et al. Relationship of Optic Nerve Structure and Function to Peripapillary Vessel Density Measurements of Optical Coherence Tomography Angiography in Glaucoma. J Glaucoma. 2017; 26(6):548-554.
- Fernández-Vigo JI, Kudsieh B, Shi H, et al. Normative database and determinants of macular vessel density measured by optical coherence tomography angiography. Clin Exp Ophthalmol. 2020;48(1):44-52.
CONFLICT OF INTEREST STATEMENT
The author of this article declare that he has no conflict of interest with respect to what is expressed in this work.
Laura Morales
Área de Oftalmología. Departamento de glaucoma-motilidad ocular
Hospital Clinico San Carlos
Tlf.: +34 91 547 03 18 | lauramoralesfernandez@gmail.com
Año 2021 · número 138 (03) · páginas 246 a 255
Enviado: 29.11.21
Revisado: 04.11.21
Aceptado: 16.12.21